
Welcome to Electric-Bikes.com
Personal Rapid Transit
San Jose-to-BART Connection
A Comparison of Two Alternatives - BART and PRTWhen 70% of voters said "yes" to Measure A, they were clearly saying "yes" to traffic relief and to more transit. Over the next 30 years, $6Billion of Measure A taxes will be spent building transit. One third, $2B, would partially pay for the BART extension to San Jose. Another $1.8+B would come from other sources for a total of $3.8B. Unfortunately, this expensive 22-mile BART extension won't provide much traffic relief because it won't provide much transit.
However, spending $3.8B on Personal Rapid Transit (PRT) would create lots of transit and true traffic relief. Following is a proposed corridor version of PRT. Click here for a possible web version of PRT.
. . .
$3.8B, 10-station BART extension . . . . . . . PRT Alternative: 150-stations for $1.9B
Most of us want less traffic or a better alternative to driving - preferably both. PRT promises both. Most transit modes require more effort than driving, making them less attractive. Any transit system that offers many car-like advantages will attract users from their cars. PRT offers those advantages. That's why people will use PRT, and why it can produce true traffic relief.
PRT is not just another technology. It's an entirely different paradigm from the types of transit we know. Instead of big and heavy, PRT is small and light - which leads to outstanding advantages:
uses almost no land (suspended above streets and sidewalks)
- quiet and energy-efficient
- minimum total cost per trip
- maximum level of service
- minimum disruption during installation
Specifically, consider these advantages of PRT technology over BART technology:
costs far less, sometimes factor 10 less, in four areas: 1) construction, 2) operation and maintenance, 3) farebox cost to users, and 4) modifying, expanding and re-using routes as needed;
- promises to actually reduce congestion throughout the county rather than just mitigating a growing congestion problem along the specified corridor;
- offers up to factor 10 more flexibility in terms of routing, station siting, capacity optimization, frequency of use, and interfacing with other transit systems;
- requires factor 2 less time to construct - system operation in 5 years rather than BART's 10 years; and
- reduces environmental impact by a factor of 3.
These are not minor differences of 10-20%. These are major advantages, in the order of 2- to 10-fold more benefit. Those who have studied PRT can see its unexcelled service at surprisingly low cost. For many people, though, it sounds suspiciously like a "free lunch". Too good to be true. For others, technical or political concerns keep them from embracing PRT's potential. Even those with open minds find that learning takes time and effort. A new technology like PRT has far-reaching impacts on our society. To better understand those impacts, check our chart of usefulness and value.
Unfortunately, VTA chose to disregard PRT during their Major Investment Study (MIS). An MIS, or alternatives analysis, examines different technologies, routes, and stations sites. All 5 of VTA's preliminary technology options for the BART connection were big and heavy: bus and 4 heavy rail options. Missing are small and light transit options. Even though PRT makes sense, existing policies and interests tend to keep us doing more of the same - even when it no longer works. We're blinded by an old paradigm, an old way of thinking, about how transit works.
Support PRT in the SF Bay Area!
Remember, BART is a commitment of 30 years, or the rest of your life, whichever comes first. If you doubt that BART will relieve traffic congestion, or you want the best results from your tax dollars, get involved. One way or another, VTA plans to spend $3000 of your dollars. That's $100/year per person for thirty years. Do you want to risk 30 years of worsening congestion?
Citizens for PRT is working with the public and private sectors to implement PRT in the Bay Area. If you would be willing to contribute at least $10 or one hour of your time, send us your e-mail address. When the timing is right, we'll contact you to complete your commitment. In the meantime, keep up-to-date by subscribing to PRT-Info for announcements about new developments in PRT science or public acceptance.
Recording secretary: Rob Means, 1421 Yellowstone Avenue, Milpitas, CA, 95035-6913, rob.means@electric-bikes.com
Further Background Information
Link to Further Information and Status of PRT Projects.
www.electric-bikes.com/prt-info.html
. . . .
. . . .
The Valley Transportation Authority (VTA) is the lead agency for the Silicon Valley Rapid Transit Corridor (SVRTC). As such , it is responsible for managing the use of Measure A transportation funds to build transit. In the case of the BART extension, $2B will come from Measure A funding while another $1.8B must come from other sources - including $0.5B from the Federal New Rail Starts Program. To qualify for federal funding, VTA must conduct the Major Investment Study (MIS).
Federal guidelines for major capital investments require other realistic alternatives to be analyzed. Approval of the MIS is contingent upon: 1) sound planning, 2) public outreach and technology comparisons, 3) regional cooperation, 4) high level of local funding, and 5) needs-based. Public outreach includes Community Working Groups in cities along the corridor. Regional cooperation is demonstrated in the Metropolitan Transportation Commission (MTC) plan. Measure A has assured a high level of local funding.
Some factors support VTA's inclusion of PRT in the MIS technology alternatives. For example, VTA's Congestion Management Program is guided by five goals, of which the first four support PRT:
enhance our customer focus (PRT-supportive)
- improve mobility and access (PRT-supportive)
- integrate transportation and land use (PRT-supportive)
- maintain financial stability (PRT-supportive)
- increase employee ownership
Other factors, however, tend to support VTA's exclusion of PRT in the MIS technology alternatives:
The BART extension to Warm Springs depends upon a rail extension (e.g. BART) from there into Santa Clara County.
- A BART extension fulfills the promise of Measure A ("BART to San Jose").
- A BART extension adds another link to the long-sought goal of "ringing the Bay" with transit.
- A BART extension provides political prestige for backers.
Then there's the challenge of completing the MIS within a short timeframe of nine months, about half the time of other MIS processes. VTA may see their job as narrowing the gap between positions, not broadening the options available. It's easy to imagine them saying "We're having a hard enough time agreeing as it is. The last thing we need is a bunch of different ideas." Since the end product of the MIS is a single option, they may fear that free-floating discussion will only delay and confuse the process.
Also, as mentioned earlier, PRT is not just another technology. It's an entirely different paradigm. That makes it difficult for people who've been steeped in transportation issues to grasp the concept and, more importantly, the implications. They, like most of us, are blinded by old thinking about transit.
A background worry for VTA is a possible legal challenge to the MIS. That could mess things up, so VTA is working hard to include the public. However, the MIS could be attacked. Why, for example, did "Status Report #1: Preliminary Definition of Alternatives" included only big and heavy technologies. The five Community Working Groups are being asked to provide feedback and participation. VTA, however, defines and screens the alternatives. So far, they've screened out all small and light transit alternatives.
One would hope that VTA, upon being asked to include PRT in their alternatives, would engage in discussions to further understand this new technology and its potential. Unfortunately, VTA seems reluctant to delve deeply into the PRT option. This raises various questions:
Are they worried about giving PRT status by including it in the list of alternatives?
- Are they concerned that no extension will be built because the needed federal money won't be forthcoming for a new technology like PRT?
- Will inclusion of PRT damage VTA's relationship with BART-supporting elected officials?
- Or do they think that they'd have to go back to the voters before choosing PRT?
- Or is this a case of ignoring an option because "it wasn't invented here"?
Without an open discussion it's difficult to determine the principles or priorities underlying VTA's screening process. One thing seems certain, though, it's only fair to include PRT in the SVRTC MIS. PRT presents major advantages over the BART - an option which is included. A quick back-of-the-envelope risk assessment would show PRT as a safer bet than BART. PRT also better matches the transportation needs of suburban sprawl.
BACK to "If you agree that PRT sounds promising ..."
PRT Corridor Proposal: 150-stations for $1.9B
[This PRT Corridor Proposal is a work in progress. Consider it a rough draft, and tell us: How can it be improved? What's wrong with it? What concerns would this proposal fail to address? Please send comments and corrections to our recording secretary. Or should we focus on a proposal like Alternative 2 which blends BART 'Light' with PRT?]
Instead of spending $3.8B on a 22-mile extension of BART, let's build a $1.9B 81-mile PRT corridor system that:
1) adds scores more stations so many more people are within walking distance;
2) adds a link to Sunnyvale so that East Bay and inland valley residents can get to jobs;
3) extends this San Jose-to-BART connection north from Santa Clara all the way to SFO so transit riders can ride around the Bay.Based on multiple studies, $10M/mile is a safe estimate for PRT costs. That includes elevated guideway, one port per mile, controls systems, and enough rolling stock to satisfy peak demand. Land costs for right-of-way are excluded because PRT can be suspended over publicly-owned roadways. That $10M/mile is one way. A PRT corridor system would require guideways in both directions for a total cost of $20M/mile. Inexpensive ports (stations) are built every mile along a PRT guideway. By staggering ports on the north- and south-bound guideways, ports can be spaced every 1/2 mile. Anyone living or working along the corridor only has to walk at most 1/4 mile to the nearest port. On average, the distance to walk will be half of the maximum distance, or 1/8 mile.
Another possibility that arises with PRT technology is that someone else may be willing to pay for some or all of the system. Remember that PRT may show a profit once constructed. If so, businesses from the private sector would clamor to help out. Grant funding for a possible solution to traffic congestion is available somewhere. With PRT, there are a number of opportunities to reduce cost and risk.
Phase 1
Use 1% of BART's projected cost ($38M) to construct a test system. Build a simple loop with two stations and an elevation rise adequate to cross railroad tracks, i.e. 26-feet minimum height). Build it at the old FMC site with the intention of moving it into actual use as a railroad crossing connecting Yosemite Drive with Curtis Avenue in Milpitas. An example of that flexibility could lie in substituting PRT for Pedestrian Over Crossings (POC). POCs enable pedestrians and cyclists to cross over railroad tracks and freeways. They cost upwards of $1.25M each. Installing a short single-loop PRT with two stations may be cheaper and easier. For example, ULTra's passive guideway is estimated to cost $1.8M/mile. After paying the $360K for the 0.2 miles of guideway - plus funding cabs and control system - the budget for a PRT crossing could still be under $1.25M.Phase 2
Given success in Phase 1, use another 6.3% ($240M) to build the link between the Capitol Avenue LRT station and the Fremont BART station (12 miles). This would eliminate the need for the BART extension to Warm Springs under Lake Elizabeth. This phase could be accomplished within 4 years. That's traffic relief many years earlier than BART!
Phases 2 - 5
Phase 3
Phase 3 would extend PRT south through San Jose to Santa Clara (10 miles). This provides the same service as the originally envisioned 22-mile BART extension. Instead of burrowing underground at enormous costs, PRT would be suspended above the streets. PRT is showy and new. Show it off to downtown visitors. If the San Jose Airport chooses to use the same PRT technology for their connection to the Santa Clara CalTrain station, then a Fremont resident could ride BART direct to the terminal. Cost: $200M. (Total cost so far: $480M)Phase 4
Phase 4 extends PRT along the CalTrain line to Palo Alto (14 miles). Here, the low cost of siting stations every mile pays off. With ports every 1/2 mile along this stretch, PRT can act as a feeder line to support the adjacent CalTrain stations. Cost: $280M. (Total cost so far: $760M)Phase 5
Phase 5 completes the Golden Triangle by linking the PRT line in Milpitas with the one at Mt. View/Sunnyvale, parallel to 237 (10 miles = $200M). Cost: (Total cost so far: $960M)Phase 6
We "ring the Bay" in phase 5. Extend PRT to SFO (20 miles = $400M). Total so far $1320M, or $1.3B (Total cost so far: $1360M or $1.4B)Phase 7
Phase 7 connects the airports and BART across the Bay. As BART transbay tube approaches capacity, the need for another link across the Bay becomes critical. People headed to San Francisco from cities south of Oakland will cross the Bay and go up the peninsula instead of through the tube. Distance = 15 miles. Estimated "over water" costs are $15M/mile due to high guideway costs. Guideways consume about 1/2 of all costs per mile, or $5M/mile. Double that for $10M/mile. Add back the cabs and control at $5M/mile to get our estimated "over water" costs of $15M/mile. Cost: $550M (Total cost so far: $1910M or $1.9M)Phase 8 - 99
With the backbone in place, PRT will extend outward in a web-like pattern as originally envisioned. Cities 21 has offered plans and routes for the Palo Alto area. Here's an example of what Milpitas might look:
BART will mitigate a growing congestion problem. PRT holds the potential to solve it.
Measure A, approved by 70+% of the voters, calls for an extension of BART to San Jose in the name of "Traffic Relief". Unfortunately, any "relief" would likely be swamped by the expected 20% growth in traffic by the year 2020.
In predicting increasing congestion, Valley Transportation Plan 2020, page 9, says we must accept and respond to this reality:
Transit improvements in congested corridors can increase transit ridership by providing an attractive alternative to driving alone in heavy traffic. However, transit travel times need to be competitive to automobile travel times. As roads become more congested, transit service is also impacted and ways to maintain and improve transit speeds becomes critical.
That means that transit will only make a difference in congestion if it's quick. Most transit times, especially on buses, are unacceptably long - and become worse when traffic is congested. That's the reality. No transit will affect congestion unless it's quick and easy.
Most of us who have endured the frustration of getting caught in traffic want less traffic or a better alternative to driving alone - preferably both. Pretend to agree on this: "People will use transit more often if the transit is more like a car than a bus." If so, then the transit people really want offers:
- a seat for everyone
- no transfers
- minimum or no waiting
- 24-hour, on-demand service
- ease of use
- privacy (no crowding or strangers)
- space for luggage
- a comfortable, smooth ride
- a quiet, clean ride
- minimum anxiety
- maximum safety
Any transit system that satisfies these criteria will attract users from their cars and produce true "traffic relief". PRT satisfies these criteria.
BACK to introduction.
BACK to "BART Risks".
A primary concern about PRT is "How risky is this new technology?" Wide-ranging factors come into play such as safety/security, cost effectiveness, and potential to miss goals or requirements. A risk assessment is needed to put things into perspective. Assessing risks implies guessing at the future. That makes it suspect at best, and possibly useless. However, just identifying various risk factors may help to sort things out and allow us to feel more comfortable with the unknowns.
VTA, like most transit agencies, is risk-adverse. Asking them to adopt a new technology that they can't touch and ride somewhere else is like asking someone afraid of heights to take a look into the Grand Canyon. Yikes! Besides, VTA took a chance on a new technology (propane-powered buses) twenty years ago and got burned. Like most humans, resisting something new comes naturally.
Here are suggested areas to consider in a risk assessment:
- cost effectiveness
- environmental/health impacts
- potential to miss goals or requirements
The potential to miss goals or requirements comes in (at least) three flavors:
schedule slips
- cost overruns
- system underperformance
Before delving into each, recognize this: Even if this PRT Corridor Proposal takes twice as long, costs twice as much, or underperforms by factor 2, it still compares favorably with a 22-mile BART extension. Having said that, let's look into the three areas of risk.
[As an aside, proponents of light rail like to ignore the number of people killed by them every year, the land they take away from parking, the businesses that go out of business during the roughly two year construction time, the energy efficiency equivalent to an auto system getting 10 to 12 mpg, the fact that they take very few people out of autos, etc.]
schedule slips
Although schedule slips are expected on new projects, we have two factors working to limit surprises. First, the ULTra PRT system in Cardiff, Wales leads us by at least a year. Their experiences will help guide us. Second, new products developed in a commercial environment are rushed along - which leads to oversights and mistakes. PRT design and engineering, especially Taxi 2000, have developed over many years. Lots of peer review has shaken out most problems and all the serious ones.
cost overruns
Existing cost estimates for PRT construction and operation are conservative. Actual costs of many PRT components (computers, sensors, telecom, etc.) have fallen over the past few years. The second hundred cabs will cost less than the first hundred. Expect another price break at 1000 cabs. It may be as likely that we'll experience a cost underrun as an overrun.
system underperformance
By ramping up over time, we give ourselves time to find and resolve bugs before full implementation and use. Taking the steps consecutively as outlined in the PRT Corridor Proposal will assure us at each step before taking the next step. Engineer for 50 mph, but start at 25 mph. Plan on the first 100 cabs as throw-aways to learn from.
BACK to "VTA and the MIS process"
People just learning about PRT suspect that something "brand new" like PRT will have many start-up problems. We've examined those risks above. Now, let's look at the risks associated with something "tried and true" like BART.
Sinking $3.8B into a single 22-mile BART extension when the entire Bay area needs transportation improvements is a risk. We risk making the wrong decision and paying for it the next 30 years. Such a risk would be prudent if many factors indicate that the BART extension is the best option. But they don't. Concerns loom large in these areas:
2. Cost-Effectiveness
When 70% of voters said "yes" to Measure A, they were clearly saying "yes" to traffic relief and to more transit. Over the next 30 years, $6B of Measure A taxes will be spent building transit. One third, $2B, will partially pay for the BART extension to San Jose; another $1.8+B is needed from other sources. Unfortunately, this expensive 22-mile BART extension won't provide much traffic relief because it doesn't provide much transit.
BART, being a corridor type of transit, doesn't fit the transportation needs of suburban sprawl. Yes, feeder systems can make it more useful as a regional transportation option. However, there's plenty of evidence to show many folks drive to BART.
Traffic congestion is estimated to cost Silicon Valley approximately $50M per day. Choosing BART over PRT delays operational transit for an extra 5 years. That's a know "risk" of $50M/day.
3. Potential to Miss Goals or Requirements
There may not be enough money to do the project. Legal challenges to BART may play a part here. Inadequate funding would strengthen those supporting BART "Light" - an extension to the Capitol Avenue LRT station.
Santa Clara County has already pledged $25-39M/year to operate and maintain the BART extension.With energy price volatility, estimates of O&M ten years from now could easily be wide of the mark.
Based on experience with previous BART extensions, it is prudent to expect significant cost overruns. Because the $3.8B estimate exclude operating costs, bond financing, payments for core system upgrades and pending BART maintenance, BATLUC estimates the likely construction and operation cost of the extension to rise to between $5.7 and $8.2 billion.
A recent rumor: the projected cost of the proposed BART extension to San Jose has risen from $3.8 billion to $4.1 billion. No apparent reason for the sudden cost increase was given.
4. Global Warming
One factor that merits top priority for everyone is Global Warming. Global warming is a global emergency, a disaster underway. It is not a potential threat. It is with us now and gathering costs, immediate and future, daily. We've got to stop burning so much fuel. Extending BART to San Jose won't make a difference in fuel consumption. But a transportation revolution at least holds the promise of making a difference. Solving the global warming problem is not somebody else's responsibility. It's ours. We need to find ways - now - to do things that are more sustainable than driving. Policymakers who collude through inaction to perpetuate the problem probably qualify as "evil" in most religious traditions.
BACK to "VTA and the MIS process"
Funding for BART is Questionable
Funding for the $3.8B BART extension is expected from these sources:
$2B from Santa Clara County (Measure A funds)
- $0.75B from state for acquisition of right-of-way (nearly complete)
- $0.5B from Alameda County (for BART extension to Warm Springs)
- $0.5B from federal sources (dependent upon the MIS)
That $3.8B price tag is likely to rise due to:
bond financing costs - No more federal dollars are expected in the Bay Area until the BART-to-SFO project is complete and paid for - about 2008. That means that bonds must be issued if work is to start before then.
- core system upgrades - Extra passenger load from Santa Clara County necessitates BART system upgrades in Alameda County. Upgrade costs will be charged to Santa Clara County.
Listed below are various transit types ranked by cost per new rider (Cost/New Rider). Although these numbers may be approximate (e.g. Santa Clara County has already pledged $25-39M/year to operate and maintain BART to San Jose), they well represent how costly BART will be. Although BART earns an impressive 63% of O&M costs from fares, it's still a money-losing operation into which no private company would invest. [The data comes from the Metropolitan Transportation Commission, Transportation Blueprint for the 21st Century Evaluation Report, June 2000 (Figure 5: Fremont-South Bay Corridor and Intra-County Projects). Note that the "PRT to San Jose" numbers are currently just guesses.
http://www.transcoalition.org/overextended.html#Technology]
transit service type
Projected Riders/day
Cost/New Rider
Capital Cost
Annual O&M
Intra-Santa Clara County Rapid Bus
12,000
$3.55
$19M
$13.6M
Rapid bus service between Santa Clara County and Fremont, Tri-Valley, Hayward, and San Joaquin County
5,000
$9.68
$20M
$12M
BART to Warm Springs and VTA Light Rail to meet it at Warm Springs
8,500
$21.55
$500M
$14.5M
Expanded Interim VTA Commuter Rail
4,600
$34.76
$470M
$9.9M
BART to San Jose
11,500
$100.49
$4,053M
$18.4M
PRT to San Jose
15,000
$xx.xx
$440M
$4M
BART "Light" (BART to LRT)
Some BART opponents say BART should end in Milpitas at the Capitol Avenue LRT station. Doing so would reduce funding needs by a factor of 4 - about $1B instead of $3.8B. That big difference is possible because nearly half the $3.8B would otherwise go to tunneling through San Jose and Santa Clara. The savings could be applied to other unfunded transit projects.To fulfill the promise of "BART to San Jose", Alternative 2 blends BART 'Light' with PRT.
Legal Challenges to MIS
Since federal money is needed to extend BART to San Jose, an approved MIS is critical. A legal challenge might derail approval. One such challenge might start like this:VTA's "Status Report #1: Preliminary Definition of Alternatives" includes only big and heavy transit technologies. Technology Options listed (page 9) include express bus, commuter rail, diesel light rail, light rail, and heavy rail. Due to the nature of these big and heavy technologies, the Alternative Alignments and Station Options are also limited. Small and light technologies open possibilities for factor 4 more alignments and factor 15 more stations. In the case of this PRT Corridor Proposal, the corridor mileage jumps from 22 to 81 while station counts jump from 10 to 150 stations.
According to VTA's "Status Report #1: Preliminary Definition of Alternatives", the MIS must first "develop broad range of possible alternative transportation concepts" and then "conduct initial screening process ...". Given the focus on big and heavy transit systems to the exclusion of small and light ones, one might conclude that the screening process had already occurred.
If small, light technologies are excluded from any consideration, even in the preliminary list of options, does that constitute grounds to challenge the MIS? Could it be demonstrated that the MIS didn't satisfy the federal requirements? If so, would other cities vying for federal transit money (like Los Angeles) support such a challenge, perhaps as "a friend of the court".
BACK to "VTA and the MIS process"
BACK to "BART Risks".
Advantages of PRT Technology over BART Technology
Personal Rapid Transit (PRT) deserves to be considered in the SVRTC MIS because, when compared to BART, PRT:
costs far less, sometimes factor 10 less, in four areas: 1) construction, 2) operation and maintenance, 3) farebox cost to users, and 4) modifying, expanding and re-using routes as needed;
- promises to actually reduce congestion throughout the county rather than just mitigating a growing congestion problem along the specified corridor;
- provides the service people want and will use;
- offers up to factor 10 more flexibility in terms of routing, station siting, capacity optimization, frequency of use, and interfacing with other transit system;
- requires factor 2 less time to construct - system operation in 5 years rather than BART's 10 years; and
- reduces environmental impact by a factor of 3.
If all factors were equal between BART and PRT except just one of these, PRT would merit inclusion in the short list of alternative transportation options. Taken together, exclusion of PRT would raise serious questions about the integrity of the MIS - and jeopardize federal funding. Let me know by the end of the week whether VTA believes that PRT deserves to be included in the technology options. If not, then I'll also need to know by the end of the week what criteria must be satisfied for inclusion. I know that's a short time, but I believe that the last day to submit input is June 15. Is that correct?
A Comparison of BART and PRT Technologies
The six differences listed above may sound outrageous to you. So, let's take a closer look at each:1) PRT costs far less, sometimes factor 10 less, in four areas: 1) construction, 2) operation and maintenance, 3) farebox cost to users, and 4) modifying, expanding and re-using as needed.
Construction costs, at $10M/mile, exceed factor 10 less per mile than BART's estimated $175M/mile. That would be great if we just wanted to save money. We could get our San Jose-to-BART connection for 1/10 the cost of BART. However, our real goal is service. I suggest that instead of saving the money, we spend the entire $3.8B and get 10 times the service of BART - 220 miles instead of 22 miles. Due to low construction costs and operating expenses, PRT fares are expected to completely pay for O&M. Some experts estimate that PRT fare recovery can also pay for system expansion. Once a PRT system reaches a critical size, it generates enough profit to finance it's own growth. With subsidies comparable to what BART and other transit systems receive, PRT fare costs could be reduced to zero for the user. And unlike BART, where changes in routing and destinations are nearly impossible, PRT is easy to modify, expand, and even deconstruct and re-use elsewhere.2) PRT promises to actually reduce congestion throughout the county rather than just mitigating a growing congestion problem along the specified corridor. In the words of Gregory Bateson, PRT is "a difference that makes a difference". PRT provides a high-service, low-cost transit system that quadruples ridership with each doubling of its size. It also supports other existing forms of transit. This characteristic is closely linked with the next, providing the service people want.
3) PRT better provides the service people want and will use. Service characteristics are important because if people won't use the system, little congestion relief can be expected. Dr. Walter Keller's "A Method for Development of a Mass Transit Evaluation Model Based on Social System Values" identifies the top three most important characteristics for the user as convenience, travel time, and reliability - all areas where PRT excels. On the flip side, people most dislike service and schedule difficulties, crowded conditions, and high cost. Again, PRT shines. Convenience is enhanced by siting stations every 1/2 mile, offering 24/7 service, and "parking" cabs at stations so users can board them immediately. Travel time is reduced because point-to-point transport effectively doubles the average speed of transit by eliminating stops. Reliability is enhanced by computer control and system component redundancy. Passengers can freely engage in other activities. There's no concern about missing their port, so they'll be free to fully attend to whatever else they'd like to do - even sleep. PRT is a system that will actually attract people from their cars, even if driving continues to be cheap (and heavily subsidized). In the words of Taxi 2000's website, PRT "provides a short, predictable, nonstop trip on a network of guideways, possibly inside to inside, a seat for everyone, climate control, no transfers, minimum or no wait, 24-hour on-demand service, ease of use, privacy, no crowding, space for luggage, no jerky motion, no objectionable sounds, no smelly fumes, minimum anxiety, maximum safety, minimum land use, and minimum disruption so that businesses need not be closed while the system is installed."
4) PRT offers up to factor 10 more flexibility in terms of routing, station siting, capacity optimization, and usefulness. Due to its minimal size and footprint, PRT guideways co-exist much better with existing infrastructure. Guideways can be routed nearly anywhere without major disruption - even during construction. Being elevated, guideways can run above arterial roadways. Stations can be tiny, modular and easily sited almost anywhere: at ground level, elevated, adjacent to buildings, or even within buildings. And at only $0.25M each, stations can economically be sited every 1/2 mile. Capacity, in terms of both cabs and guideways, can easily expand to meet demand. Generally consisting of loops, PRT can expand and flex as needed into shapes that serve our "edge city" sprawl. Today, we "edge city" residents want to get from everywhere to everywhere - at any time. PRT's computer control provides truly useful 24/7 service. Also, cargo transport is possible. The BART system, which is reaching capacity in some ways, will need substantial upgrades if extended to San Jose. PRT technology offers opportunities to address these capacity problems with creative solutions. PRT could parallel BART in the same right-of-way to increase overall BART capacity. PRT could be extended beyond Santa Clara to connect with BART at SFO thus finally realizing the dream to "ring the Bay". To address the capacity problems in the transbay tube, a PRT could link across the Bay between SFO and OAK airports.
5) PRT requires factor 2 less time to construct - system operation in 5 years rather than BART's 10 years. The ULTra PRT system in Cardiff, Wales, is already completing their initial design prototypes with service scheduled to begin by the end of 2003. We have congestion problems now. Waiting ten years to solve them is too long.
6) PRT reduces environmental impact by a factor of 3. PRT is lighter on the environment than other transit modes in terms of energy and materials use, pollution, and habitat disruption. Small, light-weight infrastructure means that the embodied energy is small. Ongoing operational use of energy is also less with PRT than BART. Even compared to relatively clean and efficient BART, ULTra's 2Kwatt per cab consumption of electricity is small. BART is especially energy-wasteful until an adequate number of people are on board. Such dramatic reductions in energy use result from the combination of an electric drive system with light weight, aerodynamic cabs. (For a deeper discussion of the factors affecting efficiency, see the Skeeter recumbent electric bike at www.electric-bikes.com/others.htm) In short, PRT exemplifies the Principles of Natural Capitalism. Saving energy means reduced pollution. If we are to meet our Kyoto agreements on reducing CO2 emissions, we must address our wasteful transportation systems.
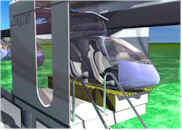

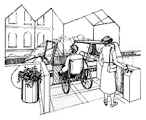
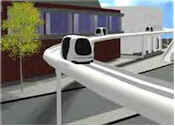
Ports, small stations where people board and leave cabs, fit in. About the size of a bus stop, ports can be sited at ground level, elevated, adjacent to buildings, or even within buildings. The left two images show minimalist elevated ports. Seat are positioned at standard chair height above the platform.
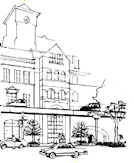
Even with the guideway above the port (second image), the scale is still small enough to blend into populated areas. Remember, that small guideway will carry the equivalent of two freeway lanes of traffic. PRT blend in like no other transit system.
The third image draws a picture of a handicap-accessible cab with pay point. Cabs designed and built for different purposes (handicapped, cyclist and bike, cargo) allow for a simplified version of the standard cab. Specialty cab passengers can expect to wait no more than 5 minutes after they call for a cab.
The fourth image presents a fully enclosed station for harsh weather areas.
Ports (stations) can be tiny, modular and easily sited almost anywhere! Minimal land requirements for ports and guideway supports
BACK to introduction.
PRT is only one form of small, light transit that could substitute for BART. At least two Group Rapid Transit (GRT) technologies may also work. Although PRT and GRT share certain characteristics (automated 24/7 service and off-line stations), they are distinguishable by the number of passengers each vehicle carries. PRT cabs carry 1-4 people, while GRT vehicles carry 10-30 people.
. .
CyberTran (left, drawing) development is on-going at the Alameda Naval Air Station.
AusTrans (right, photo) is an automated people mover system. The system uses driverless, air-conditioned vehicles, the size of mini-vans, operating on narrow gauge rails on dedicated guide-ways – installed either above, on or below ground levels. These lightweight, electrically powered vehicles are low in energy demand and provide a service that has minimal impact on the urban environment. A Sydney-based test track includes several features to demonstrate and validate the performance specification for Austrans. Features such as an 8.0 metre turning radius, 20 percent grade climbing and high speed track switches are incorporated in the track extension plans.
BACK to "If you agree PRT sounds interesting, ...
BACK to "VTA and the MIS process"
After 30 years, PRT proponents have heard almost every possible concern. And they have answers for all those concerns. Check the "38 FAQs" section at www.taxi2000.com. When considering any area of concern, compare PRT's performance to that of BART or other transit modes - not to some ideal. And remember this: any PRT shortcoming likely pales beside PRT's outstanding value and usefulness.
That said, here are several concerns that people often voice:
What about capacity? Can PRT carry as many people as BART? The short answer is "yes". A PRT guideway can transport 8000 people per hour. Check System Capacity for details.
Will the visual impact of PRT be acceptable? A PRT guideway has less than five percent of the cross sectional area of a rapid rail system such as BART. Also, the external appearance of PRT guideways can be varied to suit any specific community. For a series of representative photos, see http://advancedtransit.org/visual.htm
Note also that the Miami, Detroit, and Jacksonville people-mover (GRT) systems have guideways far larger than Taxi2000. Yet, they were approved in downtown areas with little complaint about visual eyesore.What about safety and security? What if something breaks? Although safety will be engineered into the system, realize that PRT engineers OUT the biggest liability - human error. Ninety percent of all accidents - whether in cars, trains, or planes - is due to operator error. Of the remaining safety risks associated with component failure, note that system redundancies make small breakdowns extremely unlikely and large-scale failures statistically impossible in our lifetime. The mean time between such incidents is calculated in the paper "The Effect of Redundancy on Failure Frequency in PRT," which can be found on www.taxi2000.com.
What about vandalism? Video cameras mounted at each port/station present both a deterrent and an opportunity to catch any vandals. Furthermore, PRT passengers can immediately contact security personnel from their cabs. Riders can be our "eyes on the scene".
Will the risk of developing PRT be acceptable? Because PRT uses off-the-shelf technology, development risk is minimized. Also, the proposed plan calls for development phases. Most importantly, however, is comparing the risk of developing PRT to the risk of building BART. With BART, we know we'll spend a lot of money for very little transit. Is that a 30-year risk you're willing to take? A risk assessment addresses most concerns.
Can the political resistance be overcome? This is the one concern that even PRT supporters share. Experience has shown that PRT's huge advantages over other transit options has not been enough to overcome political resistance. This time may be different because 1) we PRT supporters are actively participating in the MIS process, 2) the funding for BART is questionable and 3) a risk assessment shows PRT as safe as BART.
BACK to start of introduction.
Back to "These are major advantages."
Can small cabs move large numbers of people like traditional mass transit? Yes. Uninterrupted flow is the key to capacity, not vehicle size. For example, 60-passenger buses arriving two minutes apart (a very high flow rate for an American bus system) can carry 1800 passengers per hour. PRT vehicles coming every two seconds can provide the same capacity. Two seconds, however, is a long headway in an automated system like PRT. Headways at every 1/2 second is reasonable given today's technology. That affords a PRT guideway a maximum capacity of 7200 cabs per hour or 8000 people per hour. That's 4 lanes of freeway traffic or nearly 1/2 the capacity of BART's transbay tube. That's a lot! If that's still not enough, install another guideway. It's easy to install two guideways - either side-by-side or one above the other - in the same space as a single railroad line.
Here are the numbers:
A commonly accepted safety zone on roadways is 2 seconds between cars. Although automatic control of PRT cabs is safer and more reliable than human drivers, let's assume our PRT systems starts with that comfortable two seconds of space between each cab, a.k.a. "headway". At that headway, 1800 cabs per hour can roll down the guideway. That's 1800 people per hour assuming sole-ridership will prevail (30 cabs/min * 60 mins/hour = 1800 cabs per hour). That approximates the maximum volume of a freeway lane of traffic (2200). After a few years of operation, we may have the confidence to reduce the headway times to only one half second. That would quadruple throughput to 7200 cabs/hour or about 8000 people/hour (using the automobile ridership of 1.1 people per car). Now we're talking the volume of three freeway lanes in less than the space of one physical lane.Currently, BART has 95 miles of track with 330K daily trips. 22 miles is 23% of 95 miles. So, if the BART-to-San Jose extension achieves average system ridership, we can expect ridership of 76K per day. Worst case scenario is 38K going south to work between the hours of 6:00 and 9:00 am, and then north toward home in the evening (4:00 to 7:00 p.m.). That's about 13K per hour. After construction, several (or many) years will lapse before this ridership level is achieved. That gives us the option to start with a single set of bi-directional guideways and install another guideway when needed. It's easy to install two guideways - either side-by-side or one above the other - in the same space as a single railroad line.
Now, compare that volume to LRT and trains. Although LRT systems may be designed for high volume, the actual limit of any operating LRT system in the U.S. is 1200 riders per hour. Likewise for trains where the theoretical limit is 20,000 riders/hour, actual loading often tops out near 7000 riders/hour. An exception may be BART where reports indicate near-saturation of the trans-Bay tube at 20,000 riders/hour [is that one way, or both?].
Another capacity comparison could be made with computer controlled cars as demonstrated near San Bernardino in California. California Partners for Advanced Transit and Highways (PATH) created a stretch of automated highway system. Notice that the headway pictured is about 8 feet at 60 mph, or about 0.1 seconds. Some of PATH's research, particularly its work in the Advanced Vehicle Control Systems area, has been covered by a range of media. http://www.path.berkeley.edu/PATH/Publications/Media/
Speed is another factor in capacity. Here are critical ideas from PRT pioneer Ed Anderson:
Subj: RE: [prt-talk] Digest Number 56
Date: 5/27/01 5:32:19 PM Pacific Daylight Time
From: jeanderson@taxi2000.com (Ed Anderson)You mentioned some of the system problems. Tires vs. maglev are not the most important considerations. Curve radii increase as the square of the speed and off-line guideway lengths increase in proportion to speed. These are the most important factors. Life-cycle-cost per passenger-mile is the annualized capital + operating cost divided by the annual ridership. Costs increase with speed regardless of the means of suspension and ridership will increase with speed to a point. After a certain speed, costs increase faster than ridership so the cost per passenger-mile increases. - JEA
So, pick a speed that ensures high ridership by offering 1) a low cost per passenger-mile and 2) speeds that compete with the automobile . Absent any analysis, I pick 40 mph. Let's engineer with that operating speed in mind.
Can PRT handle peak volumes like when a train arrives or a stadium game ends?
Considers this demand scenario: a Friday evening 'peak hour' before the start of a Cincinnati Reds baseball game at Cinergy Field. During this hour 5338 passengers enter the various PRT passenger stations, of which 88% are going to the Cinergy Field stations and the balance to other stations in the network. When allowed to run to its completion the simulation produces statistics such as an Average Wait Time of less than one minute and a Maximum Wait time of under five minutes. See the detailed network simulation at http://www.skyloop.org/sims-video.htmBACK to "PRT is not just another technology, ..."
BACK to Common Concerns.
Elevated guideways holding up light cabs can also be small and lightweight. About the size of a paired set of escalators, the guideway is suspended above streets and sidewalks. That makes it compatible with a wide range of urban and "edge city" environments. Support posts, which require a footprint of less than four square feet, are spaced 50 - 60 feet apart. Construction impacts are minimal. Back to introduction.
Quiet, Energy-Efficient Technology
Avoiding steel wheels and rails dramatically reduces (say factor 5?) noise compared to heavy rail systems like BART. PRT systems using linear induction motors offer safe, sure braking - silently. Even the sound of air being pushed aside by a vehicle is much smaller when the vehicle is small.
PRT is very energy efficient. Transport by PRT instead of automobile is estimated to reduce both energy use and harmful emissions by a factor of 10! Even compared to relatively clean and efficient BART, ULTra's 2Kwatt per cab consumption of electricity is small. Such dramatic reductions in energy use result from the combination of an electric drive system with light weight, aerodynamic cabs.
In addition to reducing energy use and pollution, increasing resource productivity is key to efficiency. PRT uses fewer resources and produces more results from them. Small, light-weight infrastructure is the most obvious example. However, due to small size and high occupancy rate (i.e. efficient re-use) of cabs, the material requirements for vehicles is also much less than other transit systems. In short, PRT exemplifies the Principles of Natural Capitalism.
BACK to introduction.
BACK to Risk Assessment.
BACK to Traffic Relief.
Economics - calculating total cost per trip
When calculating the cost per trip for any transit system, include these four factors:
Cost to build/construct.
- Cost to operate and maintain.
- Cost to subsidize the consumer/user/rider.
- Cost to modify/expand/re-use as needed.
Cost to build PRT systems will run about $10M/mile, each way. For a corridor system as proposed here, that means $20M per corridor mile. That includes elevated guideways, enough cabs to saturate the area, and all control systems. It's a bargain compared with an average cost of $175M/mile for the 22-mile BART extension.
Here's a kicker to the deal - don't buy the old SP RR line. Use the streets for right-of-way. PRT doesn't require the dedicated right-of-way that BART needs. Work out a deal with the State to keep some of the $725M not spent on right-of-way.
BACK to introduction. BACK to "Risk Assessment".Operations and Maintenance (O&M)
After construction, PRT's O&M costs per passenger mile is low. So low, in fact, that PRT fares are expected to completely pay for O&M. Some experts estimate that PRT fare recovery can pay for all O&M with extra left over for system expansion. That is, once a PRT system reaches a critical size, it generates enough profit to finance it's own growth.
BACK to introduction. BACK to "Risk Assessment".Transit pricing is invariably subsidized to keep user fares affordable. Fares come nowhere near paying for O&M. Even the heavily used BART system recovers only 60% of O&M from fares. The rest is subsidized - leaving fewer dollars for other needs.
The size of subsidy per passenger mile is one way to judge the cost-effectiveness of transit systems. Here are estimated operation and maintenance (O&M) costs per passenger mile: PRT = $0.15, commuter rail = $0.28, BART = $0.35, light rail street cars = $0.45, buses = $0.55.
PRT's promise to cover O&M from fares alone, without subsidies, separates it from other transit systems. Giving PRT the same subsidy per passenger mile as other transit systems creates two obvious opportunities:
provide service for free
- finance further PRT growth (and usefulness)
BACK to introduction. BACK to "Risk Assessment".
Modify, Expand or Re-use as Needed
Rail-based transit systems, being inflexible, adapt poorly to changes over time. PRT is flexible and can be modified, expanded, or even moved, as needed. A light-weight, modular PRT guideway is easily modified to add or delete ports and routes. Adding loops or even networks to the original system is relatively easy. Even deconstructing a PRT system (or portion) for re-use elsewhere makes economic sense.
BACK to introduction. BACK to "Risk Assessment".
The trouble with buses and LRT (besides getting caught in traffic) is that drivers cost the same whether it is rush hour or not. A responsible system (like BART) closes at night to keep expenses down. Our system, though always responsive, resolves that problem.
BART
PRT
Hour of Service per Day
19
24
Average Wait Time for vehicle
10 min.
30 seconds
Average Speed (orig. to dest.)
40 mph
40 mph
PRT is available and accessible twenty-four hours a day for short or long trips. If a cab is not waiting, one will be along within three minutes.
On-demand service, elevated guideways, and system redundancy yield short, predictable trip times.
BACK to introduction.
BACK to Traffic Relief.
. . .
Again, light is the key concept. Modular manufacturing makes guideway components both inexpensive and simple to interconnect. Installation is straight forward with minimum disruption to normal activity in the area. The support posts and 60-ft. guideway sections install easily. This leads to a system that is affordable to modify/expand/re-use as needed.
Modular construction makes for quick, easy installations. That saves money and, more importantly, time. The best case scenario shows it will be 10 years before BART provides service to San Jose. Ten more years of congestion. Meanwhile, the Cardiff, Wales Urban Light Transport (ULTra) PRT will be built in only 2.5 years. Certainly, we here in the technology center of the world could build a 22-mile San Jose-to-BART extension in 5 years. That's half the time! Think of waiting 10 years for BART. Then think of 5 years for PRT. Then 4, or even 3, years. Traffic relief is possible within a few years if we "go for it".
BACK to introduction. BACK to "Risk Assessment".
BACK to "BART Risks".
Transportation Needs of Suburban Sprawl
Railroads served well the needs of the nineteenth century with its big cities and small towns strung out radially from the city along the tracks. That big city/radial arm pattern doesn't match with today's suburban sprawl. Because of that mismatch, corridor-type transit systems (electrified rail, LRT, commuter rail, and buses) don't serve us well any longer. That's one reason only 3% of the US population uses them.
Today, we "edge city" residents want to get from everywhere to everywhere. So, something like a grid transit system overlaying our sprawl is needed. PRT offers the two features required to create such a system:
being elevated, it can overlay the existing sprawl without major disruption
- consisting of loops, it can expand and flex as needed into shapes that serve our sprawl
An example of that flexibility could lie in substituting PRT for Pedestrian Over Crossings (POC). POCs enable pedestrians and cyclists to cross over railroad tracks and freeways. They cost upwards of $1.25M each. Installing a short single-loop PRT with two stations may be cheaper and easier. For example, ULTra's passive guideway is estimated to cost $1.8M/mile. After paying the $360K for the 0.2 miles of guideway - plus funding cabs and control system - the budget for a PRT crossing would still be well under $1.25M.
Excellent engineering solutions elegantly solve a problem AND contribute to solving other problems as well. So it is with PRT. Not only does it provide a high-service, low-cost transit system that quadruples ridership with each doubling of its size, it supports other existing forms of transit. For example, the proposed Cities 21 feeder system could increase ridership on both CalTrain and buses in its operating area.
BACK to "VTA and the MIS process"
BACK to "BART Risks".
Point-to-point transport offers three big advantages over transit which stops at stations along the way:
People arrive at their destinations much quicker. Point-to-point transport effectively doubles the average speed of transit. For example, although BART can travel at speeds of 90 mph, it actually averages 40-45 mph along its route due to all the required stops. PRT's running at only 45 mph can match the speed of BART. However, speeds up to 100 mph are achievable with current technology. Even at 70 mph, a PRT passenger will arrive at his destination in about half the time of driving his/her own car.
- Less energy is consumed. All those starts and stops take energy. Saving energy saves money and pollution. If we are to meet our Kyoto agreements on reducing CO2 emissions, we must address our wasteful transportation systems. Until enough riders board a bus or LRT, it is less energy-efficient than single-occupant automobiles.
- Passengers can freely engage in other activities. There's no concern about missing their port, so they'll be free to fully attend to whatever else they'd like to do - even sleep.
PRT is a humanizing technology. It provides a climate-controlled ride with a seat for everyone. Small cabs need not be shared with strangers nor can they be crowded. There's no metal wheel/metal rail screeching in turns nor smelly, poisonous exhaust fumes. There's space for luggage or a bike. And it's almost as easy to use as an elevator.
BACK to Traffic Relief.
Computer-controlled transit systems are safe. When did you last hear of an elevator or people mover passenger being killed? Just getting trapped between floors is front-page news. Although safety will be engineered into the system, realize that PRT engineers OUT the biggest liability - human error. Ninety percent of all accidents - whether in cars, trains, or planes - is due to operator error. It even eliminates the problem of drunk drivers; they may push the wrong button and go to the wrong destination, but they can't kill you.
Of the remaining safety risks associated with component failure, note that system redundancies make small breakdowns extremely unlikely and large-scale failures statistically impossible in our lifetime. The mean time between such incidents is calculated in the paper "The Effect of Redundancy on Failure Frequency in PRT," which can be found on www.taxi2000.com.
TV monitoring at each port make security part of the system. So does direct communication between each cab and security/maintenance folks. Because PRT is like an endless Mobius strip, thugs cannot waylay you at the end of the line. Individual cabs mean you don't have to share one with a stranger.
BACK to Risk Assessment.
BACK to Traffic Relief.
One way to evaluate complex projects, like transit systems, is to rank and value their benefits. Value represents the importance of the benefit (1=low, 5=high). For example, "24-hour, on-demand service" would get a high rating of "5". Ranking shows how well the transit system provides that value. Ranking also runs from 1(low) to 5(high). PRT gets a high rating of "5" because it's always ready to go.
In the table below, the benefits, values, and ratings are a first guess. Community input will be required before confidently assigning values.
Benefits
value
PRT
BART
short, predictable trip times
4
5
4
a seat for everyone
3
5
2
no transfers
4
5
3
minimum or no waiting
4
5
4
24-hour, on-demand service
5
5
4
ease of use
4
5
4
privacy (no crowding or strangers)
3
5
2
space for luggage
3
5
3
a comfortable, smooth ride
3
5
4
a quiet, clean ride
3
5
3
a safe, secure ride
3
5
5
low-cost construction and maintenance
5
3
1
reduces congestion
5
3
1
flexible routing and station siting
5
5
1
quick construction/implementation
5
4
2
reduced environmental impact
5
4
3
ease of political implementation
5
1
2
Total Value
PRT
BART
BACK to introduction.
Back to "These are major advantages."
Citizens for PRT are working with the public and private sectors to develop a test-case PRT in the Bay Area. If you would be willing to contribute at least $10 or one hour of your time, send us your e-mail address. When the timing is right, we'll contact you to complete your commitment. In the meantime, keep up-to-date by subscribing to PRT-Info for announcements about new developments in PRT science or public acceptance.


